Topic Trends, Route Memos, and What They Tell Us About Climbers

We understand that with social media, motivations and experience are openly shared in the climbing community. We acknowledge a connection this has with climbing after 2000, and see that there is a topic separation between the elite climbing community and newcomers. This shift is reflected in community structure with the reliance on Sherpas and Tibetans. We see that over time communities have changed considerably, and with the onset of commercialization of Himalayan expeditions community structures are inherently different.

We also seek to understand how motivations of climbers can be understood through their route memos. This documentation is curated in the Himalayan database from expeditions as early as 1905. Each memo contains information of the route a climbing team took, but also notes achievements, injuries, deaths, failed attempts and conflict occurring on the mountains. Many important data elements found in these memos are represented within the database, but there are rich stories in the memos that may provide insight to similarities between expeditions, which could not be obtained from raw data.

The Rise of Topic Trends and the Exposure to Danger

Using data from Reddit we unearth topics of interest in the posts. In Section 1 we find the range of topics that are distinctly separable with unsupervised learning applied on the full dataset. In Section 2 we split the dataset into train and test to evaluate the performance of topic modeling on unseen data. We also analyze topic trends in an attempt to understand the popularity of topics through the years. We observe connections with the discussion of technical/difficult routes and more novice climbers resolved to accomplish a bucket-list item.

Intent Discovery Using BERTopic with Individually Tuned Components

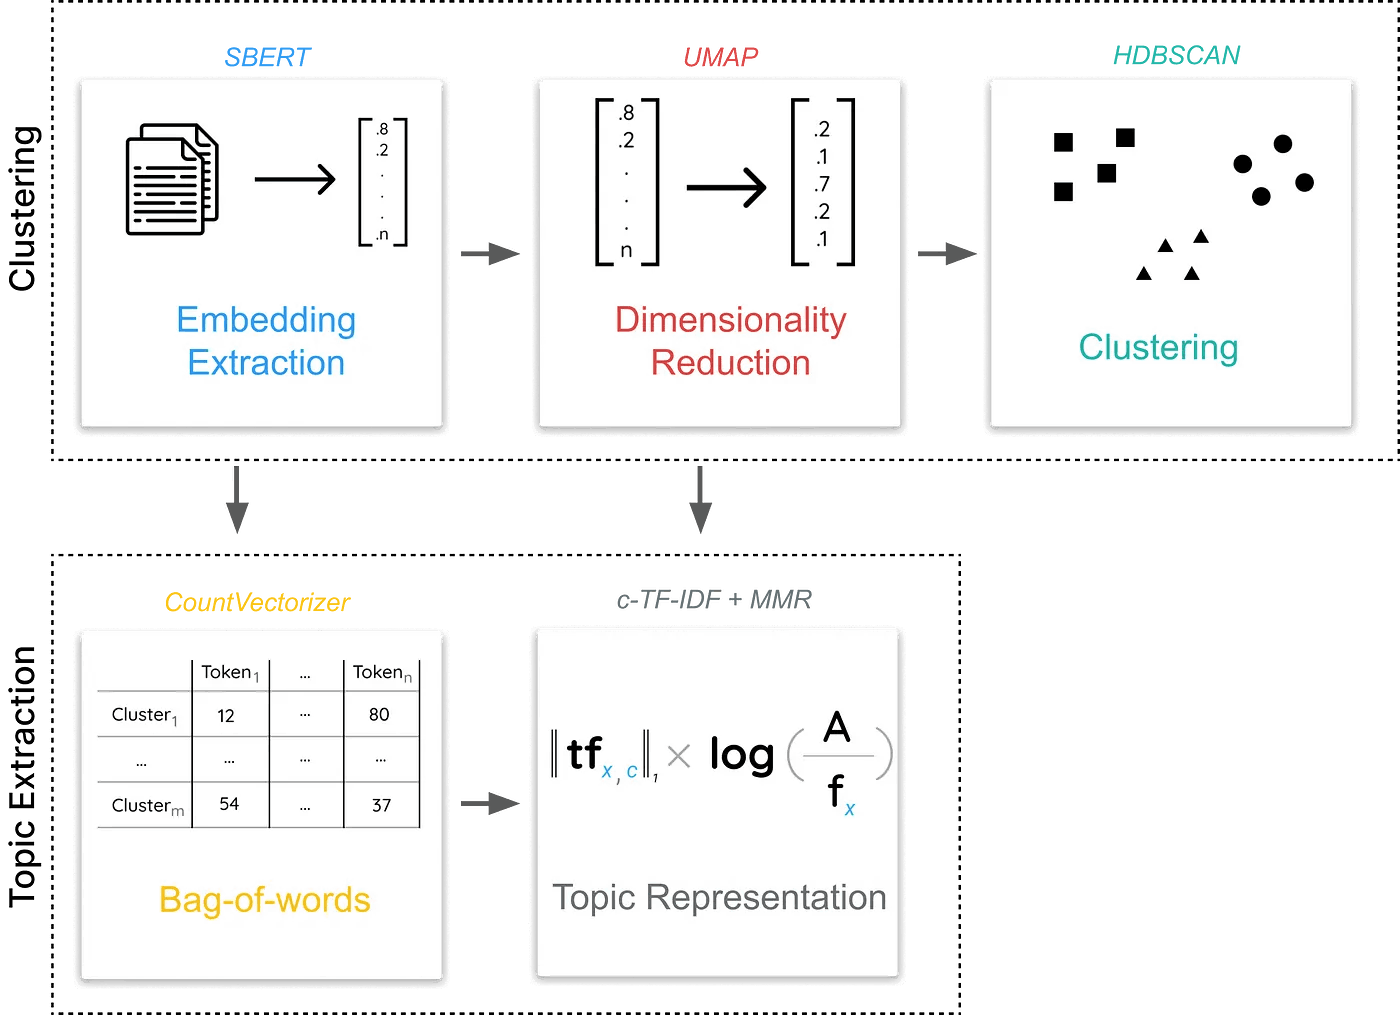
Bi-directional Encoder Representation from Transformer (BERT). topic modeling pipeline: SBERT -> UMAP -> HDBSCAN -> CountVectorizer -> c-TF-IDF -> (Optional) MMR
Credits: Maarten Grootendorst https://towardsdatascience.com/using-whisper-and-bertopic-to-model-kurzgesagts-videos-7d8a63139bdf

BERTopic developed by Maarten Grootendorst, is a modular topic modeling pipeline, as seen right, that takes advantage of pre-trained transformer models to create dense clusters and then c-TF-IDF (class-TF-IDF) to label easily interpretable topics.

Base model below refers to out-of-the-box BERTopic with default sentence embeddings, UMAP (Uniform Manifold Approximation and Projection for Dimension Reduction) and HDBSCAN (Hyper Density-based spatial clustering of applications with noise) followed by c-TF-IDF (class-Term Frequency-Inverse Document Frequency). Moreover these modules are used with their default parameters. Documents are not preprocessed but in the base model they are count vectorized with removal of stop words to produce meaningful topics. 

SECTION 1 Deriving Topics from Full Dataset with Unsupervised Learning

1032 route related post discussions filtered from 10504 posts collected from subreddits Everest, Mountaineering, and Alpinism formed the original dataset. As illustrated below, Everest route related posts are distinct from Mountaineering and alpinism which are more tightly clustered together. These latter subreddits also form a tight cluster off to the right in the figure which discusses boots and equipment specifically. This resulted in limiting the analysis to Everest subreddit route related posts (407) for unsupervised learning. 

The blue cluster on the right has posts such as: 
I started out wanting to go with "fast and light" boots (Scarpa Ribelle HD 2.0's) but something told me I might get laughed off the mountain if I tried to descend in those, and they might also get soaked quickly. The Nepals are lovely and sturdy AF, but my god are they heavy. 

Unsupervised learning using BERTopic, provides a simple and efficient way to perform topic modeling on text data. It uses the state-of-the-art transformer-based language model BERT to generate embeddings for each document in the dataset, and then applies a clustering algorithm to group similar documents into topics.

The benefit of using BERTopic is that it allows one to quickly and easily identify the most important themes or topics within a large corpus of text data. Compared to traditional topic modeling techniques, such as Latent Dirichlet Allocation (LDA), BERTopic has several advantages (Grootendorst, n.d.): 

  • It does not require extensive preprocessing or parameter tuning.
  • It is able to capture more nuanced and complex relationships between words and phrases, which can lead to more accurate and meaningful topic clusters.
  • It is designed to handle large and diverse datasets, which makes it suitable for real-world applications where data is often messy and unstructured.
  • With each Reddit post in selected subreddits being short and topic oriented, it is particularly suitable for our dataset.

Tune BERTopic Pipeline Components

We first start by breaking down the components of BERTopic i.e. the UMAP dimensionality reduction and HDBSCAN clustering to tune the individual parameters of these components. Although time-consuming and cumbersome, the findings from this manual tuning and visual analysis of the clusters created, established how distinctly separated or overlapping our clusters are. Clustering is strongly dependent on contexts, aims and decisions of the researcher as per the paper “What are true clusters?” (Henning, 2015). It is seen through this breakdown analysis and visualization that the min_dist parameter of UMAP, plays the most significant role in this dataset (full as well as subsequent train split). It controls how tightly UMAP is allowed to pack points together. It specifies the minimum distance apart that points are allowed to be in the low dimensional representation. Lower values of min_dist (0.07) resulted in tightly bound topic clusters. A more nuanced explanation of UMAP and HDBSCAN parameters can be found in the Appendix section of this document.

Automating Tuning of Parameters

Visual inspection of clustering provides an approximate range of parameters and we now refine the search for best parameters in this parameter space. The documents are converted into sentence embeddings using three from a set of pre-trained sentence transformers supported by BERTopic. Just as words can be encoded into word vectors, a sentence embedding is a numerical representation of a sentence and in its simplest form can be thought of as the average of all resulting word vectors. These embeddings facilitate the capture of semantic similarity between documents. As noted by (Reimers, 2019), “Sentence-BERT (SBERT), a modification of the pretrained BERT network use siamese and triplet network structures to derive semantically meaningful sentence embeddings that can be compared using cosine-similarity.”

Sentence Transformer Length of Embedding
all-mpnet-base-v2 (BERTopic default) 768
all-MiniLM-L6-v2 384
paraphrase-mpnet-base-v2 768

Length of sentence embeddings based on sentence transformers

The dimensionality of the sentence embeddings above are not conducive to effective clustering leading us to employ UMAP dimensionality reduction as the next step in the topic modeling pipeline. UMAP capture better local and global high-dimensional space in lower dimensions.

This breakdown into components provided us with the ‘prior’ knowledge that was then used in setting a range for the optimization space for automated hypertuning using HyperOpt Bayesian parameter search. In the evaluation results below, it is seen that the least “loss” in data points in not being assigned a topic was 0.007371 with a UMAP min_dist of 0.08. 

Index Model Loss Label Count N-neighborsN-componentsMin Cluster SizeMin DistanceRandom State
0 all-mpnet-base-v2 0.058968 7 56100.0541
1 all-MiniLM-L6-v2 0.027027 7 35100.0841
2 paraphrase-mpnet-base-v2 0.007371 6 39100.0841

Result of Bayesian search for parameters using HyperOpt

Evaluation of the Pipeline and Loss Explanation

Cluster evaluation through automation is being performed with the intention of reducing the number of un-clustered data. Ideas about automating scoring and evaluating clusters non-visually have been taken from this article. The visual dimension reduction and clustering from above gives us a sense of the range of parameters to try out. We will perform parameter tuning with HyperOpt which implements Bayesian search hyperparameter tuning.
Adopting the article's cost function, the cost is defined as the ratio of number of points with a probabilities_ value below a set threshold where probabilities_ is set by HDBSCAN clustering of data points and provides the strength of confidence of a point being in a cluster. We couple this with the range of number of clusters we are “expecting” based on our knowledge derived from the earlier visualizations of the clusters. For the dataset with all Everest SubReddit routes, the objective is defined thus:

Minimize (Cost = percent of dataset with < 5% cluster label threshold)
While keeping number of clusters between : 2 < num_clusters < 10

Just because we place a point in a cluster does not mean optimal clustering, since each point can be “its own cluster” or one large cluster can contain all the points. And so, additionally, a 15% penalty is placed on the cost function if outside the desired range of clusters. This is where we benefit from having visually inspected the output of each module of BERTopic pipeline and conducted semantic analysis of clusters, in having a baseline range of clusters expected.

We use the parameters revealed for UMAP and HDBSCAN in the tuned BERTopic along with a CountVectorizer which removes stopwords. This results in a better model in terms of reduction in the number of documents unassigned to a topic as well as topics that have significant, interpretable words. Non-usage of CountVectorizer resulted in topics with stop words and this was amended in the next iteration where we split the data into train and test data with the use of cleaned text followed by sentence embeddings.

As a result of optimal parameters discovered through automated hypertuning, only 32 points are not clustered in the tuned model (assigned topic = -1) which means the number of points not clustered is reduced by 75% (down from 132). This optimized model also shows us that 68.8% of the clustered points, that is documents, relate to Everest base camp climbs. This optimized model resulted in a loss of certain topics such as “books and movies” related topics that the out-of-the-box BERTopic model surfaced, but we do see it has made a connection of the conversations to the usage of oxygen. This uses the following parameters specified as the best parameters by HyperOpt Bayesian parameter search.

n_neighbors= 3
n_components=9
min_cluster_size = 10
min_dist = 0.08
max_n_grams=3
random_state = 42

Semantic Evaluation of Topic Labels and Documents

(Full dataset tuned model)

“I had a 48L Gregory which was more than sufficient. I carried my own weight as well, you definitely start getting used to it so I wouldnt stress so much about not choosing a porter. I finished EBC + Gokyo via chola pass with zero prep, while also being overweight. EBC is more mental than physical but obviously aim for a lighter load. You really dont need half the shit most people recommend. A hiking getup, rain gear, and a tea house get up. Toiletries, a med kit, socks and thats pretty much it.”

“I think you're confused, you are talking about two completely separate climbs. The NE ridge is in Tibet and the South Col is in Nepal. Rapid ascents are somewhat newish by Ballinger ..although Mazur of summit climb smashed it in a couple of weeks from memory. Climbing the NE ridge is new since Mallory etc in the 1920s The reason it may seem to have less traffic jams is that in recent years the Chinese have limited access to Tibet. The second step, exit cracks etc above camp 4 are still major bottlenecks if teams are funnelled into short weather windows. You're probably best served going through the different route descriptions on Alan Arnettes website.”

“She summited, but died descending. Yet it feels as if she follows me with her eyes as I pass by. Her presence reminds me that we are here on the conditions of the mountain.”

“No matter how many layers you wear you're still depending on your body to generate heat. They don't call it the "Death Zone" for kicks. Even on bottled oxygen climbers are still oxygen deprived. Combined with below freezing temps, wind chill, lack of air pressure, lack of appetite (eating)...your body will generate less heat. This obviously effects people at slightly different rates, but your body will eventually sacrifice your extremities in an attempt to keep your core warm. And that's only if you're lucky enough not to get caught in a traffic jam which is virtually guaranteed at this point (going up or coming down). Your body generates a lot less heat when you're just standing still waiting for a group of climbers to clear the route.”

“Why is it so hard to breathe even with bottled oxygen? I have been scuba diving and I did not have any trouble breathing in an environment with zero oxygen. Why do climbers on Everest have such difficulty breathing using their oxygen? Is it because a person scuba diving is able to bring more with them since it's a shorter duration and they don't have to worry about the weight?”
Topic Trends in the Full Dataset

Topic Trends in full Reddit dataset. Top figure shows the frequency of all topics over time. The bottom figure shows only topic 0.

Topic trends show that the frequency with which people are attempting to climb Everest up until the base camp and the interest primarily lies in short trips on Everest and adjacent peaks. When focusing on the base camp treks which forms 68.8% of the discussions, in each of the spikes we find the words related to the logistics of the hike such as “lukla” (airport closest to the site from where base camp treks commence), books of interest and hobbies. In the first half of 2021, we see the words like infections and Covid trending, along with permits. Topic 4 which shows a spike in July 2019, predominantly revolved around trash. This topic mainly focused on oxygen usage and these two (oxygen and trash) discussions were clustered together in this manner, probably because oxygen canisters form a large part of the debris and garbage left behind.

Intent Discovery

Although BERTopic provides us with labels, using c-TF-IDF and CountVectorizer, intent discovery was additionally performed by selecting the noun chunks from each clustered topic, splitting this chunk into individual nouns and sorting by highest frequency. The nouns were then joined together to form an informative label. These labels were not found to be more informative than BERTopic labels and so the topics created by BERTopic are relied upon in further analysis.

Trek_guide_porter_ebc_day_camp_base_good_time_nepal
Ridge_climb_step_hillary_south_camp_summit_northeast_climber_north
Climb_sherpas_good_sherpa_climber_ladder_summit_big_camp_story
Climb_peak_summit_trail_body_time_difficult_climber_d_point
body_summit_report_attempt_team_remove_mallory_ray_snow_day

SECTION 2 Evaluation of Unsupervised Learning with Manual Labeling

In order to be able to evaluate how good the unsupervised learning task is on unseen data, we split the subreddit Everest route related dataset into train and test split. The train set contains 382 documents and the test set contains 25 documents. Another difference in this analysis is the usage of cleaned text as opposed to the usage of raw reddit data in Section 1.

Cleaning List
Extract word tokens, remove excess spaces, remove links
Add to stop words 'route', 'think', 'thank', 'people', 'everest', 'mountain', 'm', 'I', 'd'

Cleaning and SpaCy lemmatizing applied on posts on train set documents

But as mentioned above, with just a sentence transformer followed by dimensionality reduction and clustering and no CountVectorizer with removal of stop words, resulted in topics dominated by stop words such as ‘to’, ‘and’, ‘of’ despite the usage of reduce_frequent_words parameter in the ClassTf-Idf. In this section, we therefore begin with cleaning text by removing unnecessary characters and formatting, removing stopwords and lemmatizing the words with SpaCy. The CountVectorizer was created with 2-gram since there is common usage like “Mount Everest”, “Hiking Boots”, “Himalayan Expedition”.

Topic Count Name
-1 21 -1_death_death zone_zone_trip
0 126 0_climb_summit_climber_body
1 11 1_furtenbach_covid_sherpa_camp
2 224 2_trek_day_guide_porter

Base model topic assignments of train set documents

When using only a reduced dataset for training, the number of topics created drastically reduces as seen above. We have lost topics revolving around oxygen usage and books for instance. But it also surfaces the real concern of the Everest Sub-Redditers. The baseline has three clusters into which the topics were placed. 94.5% of the documents were placed into a topic, setting a very high baseline. The topic -1 below is the only set of documents not clustered into a definitive cluster.

BertTopic with Tuned Components in the Train Set

The ranges for the parameters for HyperOpt Bayesian Parameter Search were taken from the unsupervised learning applied on the full dataset task, where visualizing the cluster separation and semantic understanding of topics in a cluster provided us with a reasonable range. The best sentence embedding is the default sentence embedding used by BERTopic. Unlike the analysis in the above section, we are using this sentence embedding on cleaned lemmatized tokens as it suggested more illuminative topic labels.

When creating the tuned model though, it was seen that a better separation of topics, more nuanced and distinct topics arose from changing the min_dist parameter for UMAP. This has been the case throughout the analysis (from the unsupervised section to the partially supervised Section 2). This parameter, when set to a low value, aids in “emphasizing the similarity of dense clusters” of samples (Armstrong, n.d.). The hierarchical linkage of topics created is seen below shows topics 1, 2 and 3 regarding short treks, base camp treks and first time trekker planning logistics are hierarchically linked at the first levels by agglomerative clustering algorithm HDBSCAN. 

Topic Hierarchy in the train set

These three together account for nearly 60% of the posts. The second largest clustering is of climber routes, bodies and remains in Topic 0 which is about technical discussions about the routes. The last clustering falls into Topic 4 which is distinctly about Covid pandemic and the impact of Covid on Sherpas and their livelihood.  

Semantic Evaluation of Topic Labels and Documents

(Train set tuned model)

“The Northeast Ridge I feel i know so little about the Northeast ridge route, compared to the South col. Is there anyone who has taken the route on the North face, who could go through it.”

“The guides usually carry a first aid kit with altitude sickness medication for those in need. I got pretty sick after Namche. Diamox saved my life! Don’t underestimate altitude sickness. There are EBC trek fatalities every year.”

“Do You Know, how far is Everest Base Camp from Kathmandu? **Mount Pumori (7,161m) view on the way to EBC Trek 10 Days –”

” 'I did EBC in December 2015. Finding a guide/porter should be easy, just ask around in Lukla and you will find dozens.”

“I replied on the thread about the furtenbach interview with AA and I'll say it again. I'm dismayed at how little value the Nepalese government is placing on the wellbeing of the sherpas. The mountain should have been closed and the permits extended, but it seems like they don't care what happens to the sherpas as long as they bank the climbing permit revenue and anyone who left due to covid/covid fears will have to pay again if they want to come back.”

Topic Trends in Train Dataset

Topic trends in Reddit post train dataset. Top figure shows the frequency of all topics over time. The bottom figure shows only topic 0.

Although there is a loss of topics from reducing the size of the dataset to split and evaluate it, the primary topics of interest continue to be ascents to the base camp and short trips. The three topics that deal with shorter guided treks (topics 1, 2 and 3) also spike in frequency with words showing their significant contributions such as “care, ease, respectful”. The impact of Covid on the livelihood of Sherpas is strikingly noticeable in 2021 postings. As in the analysis of the full dataset, death (bodies and remains) and route technicalities in topic 0 is a smaller but frequent topic of discussion indicating, not surprisingly perhaps, how critical the choice of routes is to success of an expedition. This discussion is also distinct from the larger set of topics about base camp treks that can be presumed to be less experienced climbers.

Evaluation of Model

The test set without any predicted labels attached was labeled manually by each of the team members. The homogeneity in their ratings or lack thereof was evaluated using Krippendorff’s Alpha. This formula is a statistical measure of the agreement achieved when applying a set of labels This formula outputs a value between 0 and 1, where 1 is perfect alignment. Scores above 0.8 are considered “good reliability”, scores less than 0.667 are considered inadequate, and indicate no inter-rater reliability (Krippendorff, 2004).
This value for the small test set was barely above the minimum acceptable threshold at 0.67.

From among the 12 documents that had the same label across all the raters, the prediction from the model matched 7 leading to an accuracy value of 58%. This value is too low to certify the model as a valuable tool as a topic modeler for Reddit post topic modeling.

Those who attempt the climb are clearly aware of their own mortality and the risks. Bodies of past explorers like David Sharp and “green boots” remains on the routes are discussed and news of climbers meeting with their demise is tweeted. Despite this awareness, leadership and courage shown by Edmund Hillary and Sherpa Tensing Norgay continues to resonate with expeditioners, 70 years since their summiting the mountain. The interest shown in social media is focused not on “conquering the mountain”, as much as to climbing to the base camp(s) which is a feat in itself as they are at over 5000 meters. The posts regarding impact of Covid on the economy of Nepal and livelihood of Sherpas indicates how dependent their lives have become on the rise of expeditions as they form a large support system for expeditions to the base camp and beyond

Like a Rock: The Steady, Unchanged Climbers

We hypothesize that route memos from different climbing periods have differentiated content. Do topics, thoughts, and stories change over time similar to how Himalayan expeditions have channeled new eras? In (Savage & Torgler, 2013) it is noted that “To date there has been very little evidence demonstrating shifts in social norms, emotions or group identity over time in extreme, or life and death situations.” We will explore this sentiment by looking at the content of the route memos. From (Collins-Thompson, n.d.) We have learned the clustering can be used to identify similar groups from a corpus of documents. We will follow this approach to explore our question.

Evaluating Clustering as a Concept

First, we will evaluate if it is possible to create clusters from our text data. That is, to explore what a clustering task could produce based on clustering quality principles (Collins-Thompson, n.d.) :

  • Clusters are dense – the within-cluster distance between points is small.
  • Clusters are distant - the between-cluster distance is large.
  • Representation – the clusters provide meaningful groups which are evaluated in downstream tasks.

Our task will focus on concepts 1 and 2 at this stage, specifically establishing the appropriate number of clusters. We will use two indexes to measure the ratio of within-group variance to between-group variance. These indexes are the Davies-Bouldin index (DBI) and the Calinski-Harabasz Index (CHI). The scores will be cross referenced to find the “optimal” number of clusters (Collins-Thompson, n.d.).

DBI has an intuitive interpretation, it measures the average similarity between each cluster and the most other similar cluster(s). When the clusters are very different the score becomes smaller. Also, this metric is rather robust against noise, and so in early stages of assessing the data without in-depth cleaning, this is ideal. To check the validity of the scores, another metric should be used to cross-reference results. There are many options, but the CHI is another intuitive starting point. It's an easy-to-understand metric like DBI; here we look at the ratio of the between-cluster variance to the within-cluster variance. A higher score means the clusters are well formed and separate. Also, this metric is a bit robust against noise, so again, we don’t need to be overly concerned with complex cleaning to assess if this is working. When we review the scores with DBI, the lower score is better and with CHI higher is better.

We propose a novel way to compare the two scores. We can normalize the values, so the highest score is always 1 and the lowest score is always 0. Then we can weight the DBI and combine the scores, so the highest value represents the best combinations of scores. This is imperfect, so it will still require manual inspection, but it allows us to greatly narrow down the K selection.  

Cluster Exploration. Using Davies-Bouldin and Calinski-Harabasz index we can estimate the optimal number of clusters

From our results we can see an optimal number of clusters around a K of 5. DBI suggests that the ideal K is somewhere between 5 and 9, while the CHI shows a sharp drop off initially and then slowly tails off. When we combine these scores, we converge around 5, which is suitable for us to evaluate the task at this stage.

The visualization of the clustering  of route memo topics demonstrates that a clustering task is possible on this dataset. We observe clusters showing separation

Utilizing TSNE with TruncatedSVD we can reduce the output so that the clusters can be visualized. TruncatedSVD and TSNE are often used together as reduction techniques to visualize high-dimensional, sparse, data (Maaten & Hinton, 2008), (Zamanighomi et al., 2018). Visual inspection is subjective, but at this stage we would expect to see some groups, to suggest that the model can differentiate content (Collins-Thompson, n.d.). When we have a poorly optimized cluster we see groups forming, but they are not the best representation of our quality criteria. When optimized, clear groupings emerge.

We can conclude that clustering is possible with this data and can look to refine our data for this task. 

Pre-processing

The type of pre-processing on the data will impact your results (Kutuzov & Kuzmenko, 2019). The choice to lemmatize words (reducing them to their roots), dropping stop words, dealing with abbreviations, dates, and names all have an impact. Words are lowered since we are not concerned with sentence structure. Extra white spaces are removed, along with excessive new lines and special characters. Numerical values were not removed, and when identified, feet were converted to meters.

Abbreviations also were prevalent in the un-processed text. (Okazaki & Ananiadou, 2006) propose methods in which to identify abbreviations from text within the sentence. We can adopt this line of thinking and apply it to the corpus since abbreviations are domain specific (e.g., BIV for bivouac). This was done by first creating a list of all possible abbreviations, this was achieved using regex to search for content that was not a stop word, and that was only 3 letters. While 4 letter abbreviations are possible, they were not common within the corpus, so they were not considered. Next, following (Schwartz & Hearst, 2002), a c-value score was calculated at the corpus level (rather than sentence). From this the highest c-value abbreviation definitions were chosen. Finally, the frequency of these abbreviations was assessed and most abbreviations that were useful did not benefit from being decoded (e.g., occurring less than a few hundred times in the corpus). Of the group specific abbreviation that high frequency they were added to the cleaning. As noted, lemming (reducing a word to its root) can be a helpful step (Kutuzov & Kuzmenko, 2019). We include it in our evaluation and create a lemmed vs non-lemmed corpus. Finally, we will split the data into four distinct groups that represent the different climbing periods. 

Broader Hyper-Parameter Tuning with Grid Search

Using a grid search we can test many combinations of hyper-parameters. N-grams over 3 produced few clusters during testing because as the size of the ngrams increases, the number of possible combinations decreases (Speech and Language Processing, n.d.). As the size of the ngrams increases, the resulting clusters may become more specific and less general. This can lead to fewer clusters overall, as the clusters become more distinct and specific to certain patterns within the data (Aggarwal & Reddy, 2016).

Our grid search evaluated over 900 possible combinations; from this it was observed that:

  1. Generally, more clusters did better.
  2. The hyperparameters had little impact over k (number of clusters).
  3. One ngram type did not perform “better” than another, however scores indicated higher quality clusters with bigrams and trigrams.
  4. Some periods saw scores to suggest issues with outliers and overfitting.

When we evaluate model performance, it is natural to compare the results of one ngram type, and period to another. We cannot do this with the indexes chosen. The results are specific to the model and it is invalid to make a side by side comparison. We can, though, look for trends that suggest some combinations are performing better than others. In the below images the results show scores on the y-axis for each hyperparameter/ngram/period set, which is defined as an index on the x-axis. Non-lemmed sets are colored gray, lemmed sets are colored blue.

Grid Search Results. Using a grid search we test different input criteria for cluster tuning. Lemmed (blue) vs Non-Lemmed (gray) text show little difference, while clusters greater than 7 have better index scores.

We see models compared between the exploratory unigram (left), and transitional unigram result (right). As the index increases from left to right on the x-axis the number of clusters increases. We see from these results more clusters performed better than fewer clusters. It is also noticeable that there is no difference between the lemmed and non-lemmed versions of the input corpus.

Some results suggested that the models had outliers or were overtrained. We see this in the commercial unigram results with Calinski-Harabasz scores that are in the millions. While scores of several hundred thousand can be seen, scores in the millions suggest issues with the input (Caliński & Harabasz, 1974). However, there is enough data from the other models to overcome these results and we can conclude that ngrams higher than 7 showed better results. The other hyper-parameters had little impact and so our final will use a probabilistic search method such as RandomSearchCV to optimize the model. Overall, focusing more on the Davies-Bouldin scores which showed fewer issues, bigrams and unigrams had lower scores. As a result, we focus on these ngram types for the final model. 

From the insights we have gathered visually exploring tuned models can help determine our final configuration. First, we will look at a cluster from the exploratory period, which is optimized at 9 clusters. This output does not meet our definition of quality. There are few clusters noted, the data is evenly spread out and amorphous, instead of having distinct clusters forming. One issue could be that creating groups per period may be too restrictive. This could also explain why the Calinski-Harabasz scores became so high, which may be a byproduct of over training. Another approach would be to split the data into two periods, early vs late. If we dichotomize the data into pre-1970 and post-1970 expeditions, there may be more data to form clusters. Unfortunately, we can see the results are not any better using this approach. However, when we use the entire data set, bigrams, and trigrams both produce promising clusters.

Trying different topic clustering.
Dividing the route memo data does not produce quality clusters based on our criteria. Using the entire corpus we see that bigrams and trigrams produce separated and distinct clusters

The results are salient. Breaking the data into periods does not produce better models. When we look at the data as a whole we see groups emerge from the route memo clusters. Visually, trigrams have clusters that are more separated, and this is intuitive when we consider the lower probability of trigram words passing term frequency thresholds. The clusters divide the content into periods, however we cannot conclude content may be related to specific periods of time.

Label: 0 Years: 1905 - 2022
Label: 1 Years: 1952 - 2020
Label: 2 Years: 1929 - 2022
Label: 3 Years: 1949 - 2022
Label: 4 Years: 1966 - 2019
Label: 5 Years: 1986 - 2022
Label: 6 Years: 1988 - 2022
Label: 7 Years: 1985 - 2022
Label: 8 Years: 1983 - 2022
Label: 9 Years: 1950 - 2021

Here we evaluate the expeditions from the labels that have considerable overlap. Our concept that the memo content may be related to specific periods does not hold. We can reason this for the following reasons:

  1. When using periods to divide topics memos do not meet the quality thresholds described, that clusters visually, do not pass inspection.
  2. Clustering using an entire corpus does not naturally divide the content into specific periods. There is content from multiple periods within clusters that suggest content in the memos is not period specific.

Topic Modeling

In addition to the period clusters performing poorly visually, they also did not produce topics that were sufficiently different between groups, or even for the entire period. This is consistent with the findings that clusters were not well formed when we separated the expeditions by period. We ask if this suggests that route memo content has not changed? To explore this further we will look at a few different methods to extract meaningful topics from our data.
First, we can use a term score as a simple method to see if this produces topics that appear to be differentiated. What we are looking for are topics that seem specific to a group, but not globally. If a topic can be applied to many clusters, it does not represent a distinct group. By extracting the terms from the clusters we can use the topics close to the centroid as the “best” representation for that group. Then, applying a term score that evaluates how specific each word is to a particular cluster (Collins-Thompson, n.d.). A simple way to think about a term score is to evaluate how surprised we are that a word exists within a specific cluster against the corpus and other clusters. If a word is more likely to occur within a cluster than by chance, we would consider it a good representation of that cluster.
While this sounds promising, the results do not lend themselves to interpretation well. Evaluating results from clusters of the exploratory period we get the following topics: 

  1. ['10 1929 suggestion', 1929 mr farmer', 'ang tsering day', 'camp ang tsering', 'camp mr farmer', 'chapman wa hurry', 'climbing difficulty final', 'farmer called camp', 'farmer sonam topgay', 'farmer wa going']
  2. ['nearby howell cleare', 'paldor account unknown', 'paldor early november', 'peak nearby howell', 'rapelled face ridge', 'really did climb', 'ridge did exist', 'ridge tilman ridge', 'se ridge tilman', '10 1929 suggestion']
  3. ['look forward receiving', 'near c2 father', 'norman dyhrenfurth 25', 'old iceaxe wa', 'piece knowing climber', 'place certainly chettan', 'placed grave recent', 'prewar clothing small', 'receiving piece knowing', 'recent avalanche brought']
  4. ['named peak nupchu', 'peak nupchu believed', '10 1929 suggestion', '1929 mr farmer', 'ang tsering day', 'camp ang tsering', 'camp mr farmer', 'chapman wa hurry', 'climbing difficulty final', 'farmer called camp']
  5. ['lewa sherpa roundtrip', 'main summit hour', 'roundtrip jongsong main', '10 1929 suggestion', '1929 mr farmer', 'ang tsering day', 'camp ang tsering', 'camp mr farmer', 'chapman wa hurry', 'climbing difficulty final']
  6. ['mountaineer autumn 78', 10 1929 suggestion', '1929 mr farmer', 'ang tsering day', 'camp ang tsering', 'camp mr farmer', 'chapman wa hurry', 'climbing difficulty final', 'farmer called camp', 'farmer sonam topgay']

The results show many repeated words in each cluster, and topics that are difficult to identify as unique. While some combinations of words like “really did climb” or “main summit hour” appear somewhat unique the noise from “mr farmer” suggest too few documents in this period to be useful, or the over abundant documentation of a single expeditioner (most likely the former). Evaluating other periods gave similar results.The results do not provide a clear sense for each group.
We must consider if noise from the presence of noise is throwing off our topics. One way to test this is to remove words that are not parts of speech. Using spaCy, we can use a dictionary to determine if a word is a noun, verb, etc., and keep only parts of speech that have syntactic meaning. When we do this, we produce the following clusters from the trigrams of the exploration period: 

  1. ['ab attempt east', 'chapman hurry left', 'climbing difficulty final', 'glacier left glacier', 'limit pm time', 'little difficulty turned', 'little mountain identified', 'little pas ft', 'little rock rib', 'little snow rock']
  2. ['main summit hour', 'roundtrip main summit', 'ab attempt east', 'chapman hurry left', 'climbing difficulty final', 'day ration started', 'farmer called camp', 'glacier left glacier', 'ground time necessary', 'heavy cloud intervened']

While the noise is cut down, we can observe that without the grammatical particles present the topics are not better (we conclude this objectively) from the above clusters with “noise”. They are easier for human interpretation without the grammatical particles, but do not make a better representation of each group. Using the same approach for the “early” period we get cleaner, but not better results: 

  1. ['day base camp', 'advance base camp', 'advance base ft', 'advanced base camp', 'alpine club expedition', 'appears expedition expedition', 'apt peak big', 'arrive base camp', 'arrive sept arrive', 'arrived base camp']
  2. ['expedition prior probably', 'prior probably climbing', 'advance base camp',  'advance base ft', 'advanced base camp', 'alpine club expedition', 'appears expedition expedition', 'apt peak big', 'arrive base camp', 'arrive sept arrive']

Neither approach, using parts of speech only, or the entire corpus, shows differentiated topics for each cluster.

Term frequency is not the only way to approach topic modeling. There are several different topic modeling algorithms, another method is Latent Dirichlet Allocation (LDA). LDA works by analyzing the words in the documents and grouping them into topics based on how frequently certain words are used together. It assumes that each document is made up of a mixture of different topics, and that each topic is made up of a set of related words. LDA is a powerful tool for analyzing text, but it is important to remember that it is just a model and the topics that are identified by LDA may not be the same as the topics that a human would identify. However, LDA can still be a useful tool for understanding the content of a corpus of text (Jelodar et al., 2019).

Using LDA to one the exploration period does not produce topics that suggest clear separation of content. Here we will evaluate the 3 most frequent words: 

  • Topic 1: camp, farmer, day, ice
  • Topic 2: ridge, day, snow
  • Topic 3: claim, guide, say

LDA has a parameter lambda that allows us to control how words are selected. Values of lambda that are very close to zero will show terms that are more specific for a chosen topic. This means that we will see terms that are important for a specific document but not globally. When we lower lambda on our exploratory period we get:

  • Topic 1: farmer, halted, return
  • Topic 2: pyramid, basin, gully
  • Topic 3: claim, guide, say

The returned values become very document specific and cannot be interpreted globally. Additionally, the topics provide little insight to important period characteristics. When we apply the same method to the global trigram clusters, our results are equally poor:

  • Topic 1: c2, bc, wa
  • Topic 2: sherpa, summit, everest
  • Topic 3: bc, wa, day

Once again, reducing lambda does not improve the topics:

  • Topic 1: ridge, glacier, ice, west
  • Topic 2: 09, nst, independent,
  • Topic 3: phortse, Makalu, lhamu

Using the clusters without grammar particles, attempts are also nonsensical, and uninterpretable.
Our final attempt to garner some results could be to use an entirely different method to date. ChatIntents is a package that automatically clusters and applies descriptive group labels to short text documents, which is an ideal algorithm for our corpus (Borrelli, 2021). Using this on the all-period trigrams we can assess each cluster: 

  • Label 0: 'left_bc_summit_day'
  • Label 1: 'lhotse_everest_summit_member'
  • Label 2: 'wa_camp_base'
  • Label 3: 'went_m_day_face'

Using unsupervised methods to discover topics from within clusters or periods produces unintuitive, uninterpretable results. Clusters and periods surface words that are globally related to climbing or are so document specific have little meaning to a subgroup of data. Directions, camps, ropes, summits, and snow are expected content from a mountain climber expedition memo. Our results produce little to suggest interesting and informative content exists within the documents that are not already described by the structured data. It is interesting however, that Everest was separated as a topic. We observe overlap here to results of the social-media analysis.

Ground Truth Labels

Human created ground truth labels are objectively better than unsupervised attempts to produce labels (e.g., topics) because they are more accurate and reliable (Odumuyiwa et al., 2022). Human annotators can understand the context of the data and apply their knowledge to label it correctly. In a final attempt to produce labels that could be used to identify a topic shift per period we assess how humans label topics from a sample of memos. Randomly, 50 memos were taken from the corpus. From the memos, topics were developed and criteria set for the evaluation of each topic type (see appendix).

These topics were then applied to the 50 memos. Two volunteers were asked to read and additionally apply one of the topic labels to each memo while being blinded from other attempts. The labels were then evaluated using Krippendorf’s alpha to determine the reliability of the labels (Krippendorff, 2004).

The results for this label set were 0.63, which indicates no reliability. Labels were reassessed to reduce overlap and focus on specific content. This reduced the label set to “Bad conditions”, “Factual Route Description”, and “Injuries/Accidents/Death” (see appendix for the full label set). Using only three labels would likely increase inter-rater reliability, but would be too general to determine topic shift from between periods.

The sample memos were then evaluated for word choices best represented each memo. The task was to use human interpretation and produce 3 words that best described each memo. The results of this attempt were too document specific and words/labels generated did not apply to other memos. From these attempts it was determined that it was not feasible/possible to apply labels to the memo content and create distinguishable categories.

From this analysis we found that clusters by climbing period (exploration, expedition, transitional, commercial and social-media) did not form quality, well-separated clusters. Instead, clusters appeared to be well formed when taking input from the entire corpus. The clusters we saw did not differentiate data into specific periods, most clusters spanned multiple periods suggesting that content is not time specific. Our expectations would be to see memos of similar writing style, vernacular, or content (e.g., injuries, death, success) to be grouped together. If this content varied by period, the expeditions that appeared in each cluster would reflect this and early years would cluster together vs expeditions from later periods clustering together. What we saw was that content could be differentiated, but the year of the expedition was not significant meaning that content has not changed over time.

We also attempted to isolate topics from clusters, and periods from the route memos. From various attempts to identify topics through unsupervised methods, as well as human intervention, we did not pass reliability thresholds or create topics that articulated distinct characteristics of each group. Topics were similar in content and language, which mirrors the results from clustering – which is that the content falls into categories, but these categories are similar and do not provide us with insight about methods, actions, or the history of climbing.

When we reflect on the memo content, the results are intuitive. Memos are written for future climbers, cataloging important route characteristics and stories of those who may be the first to discover a path that will be traveled for years to come. If we consider the number of first ascents over time, we see that in the past 10 years there are as many first ascents occurring as there were 25 to 35 years ago.  

The number of first ascents by year (blue) and rolling average (gold) show there has been as many first ascents in the past 10 years as there were 25 to 35 years ago.

This suggests that the drivers to undertake these dangerous climbs haven’t changed with time. Technology, gear, and information may allow newcomers to stand at the top of the world. However, the hard-core, mountaineering experts continue to explore the region with the same intent, difficulties, and desire as those that came before us.

“There is something about the Himalayas not possessed by the Alps, something unseen and unknown, a charm that pervades every hour spent among them, a mystery intriguing and disturbing. Confronted by them, a man loses his grasp of ordinary things, perceiving himself as immortal, an entity capable of outdistancing all changes, all decay, all life, all death.”

Frank Smythe

Statement of Work (April 2023)

Simi Talkar

- Project scout and environment setup
- Exploratory Data Analysis
- Dash App (lead and creator)
- Docker container
- Scraping and API retrieval of social media data and analysis (Twitter/Reddit)
- Final write-up (lead)

Brian Seko
  • - Data cleaning and structure
  • - Route Memo Clustering
  • - Route Memo Topic Modeling
  • - Climbing Period Feature Analysis (not included here)
  • - Final Write-Up (lead)
Matthieu Lienart
  • - Scraping of additional Himalayan peak data
  • - Data cleaning and structure
  • - Neo4j Database
  • - Network Analysis
  • - Poster Creation (lead)
  • - Website (lead)
  • - Final write-up