In (Savage & Torgler, 2013), the authors suggest an impact of commercialization on the climbing community. They state:
While the study of social medial and route memos do not suggest a change over time in the motivations to undertake these dangerous climbs, we have identified changing cohesiveness and relationships' trends between the Sherpa/Tibetan and Non-Sherpa/Tibetan communities. In this analysis we circle back to the start of the commercial period in 1988 and test the following hypotheses: does commercialization affect intra community cohesion, inter community cohesion and relationship strength between communities of commercial and non-commercial expeditions? Given the assumptions around the network design, these metrics provide intuitive and clear measures in which we can test the claims stated by (Savage & Torgler, 2013).
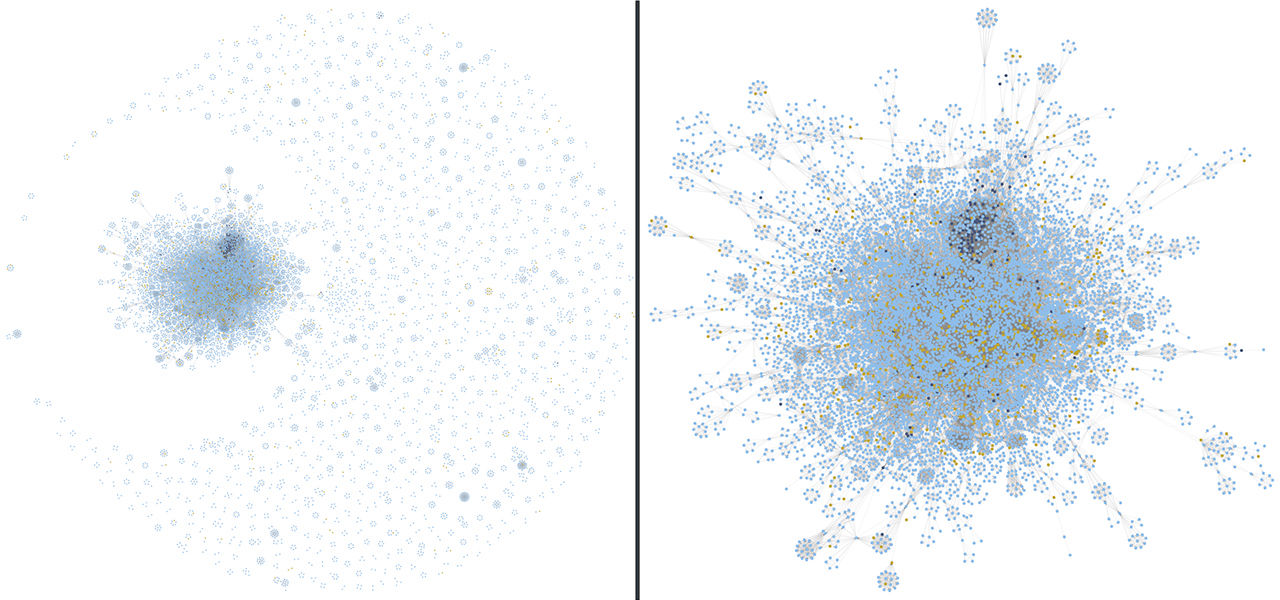
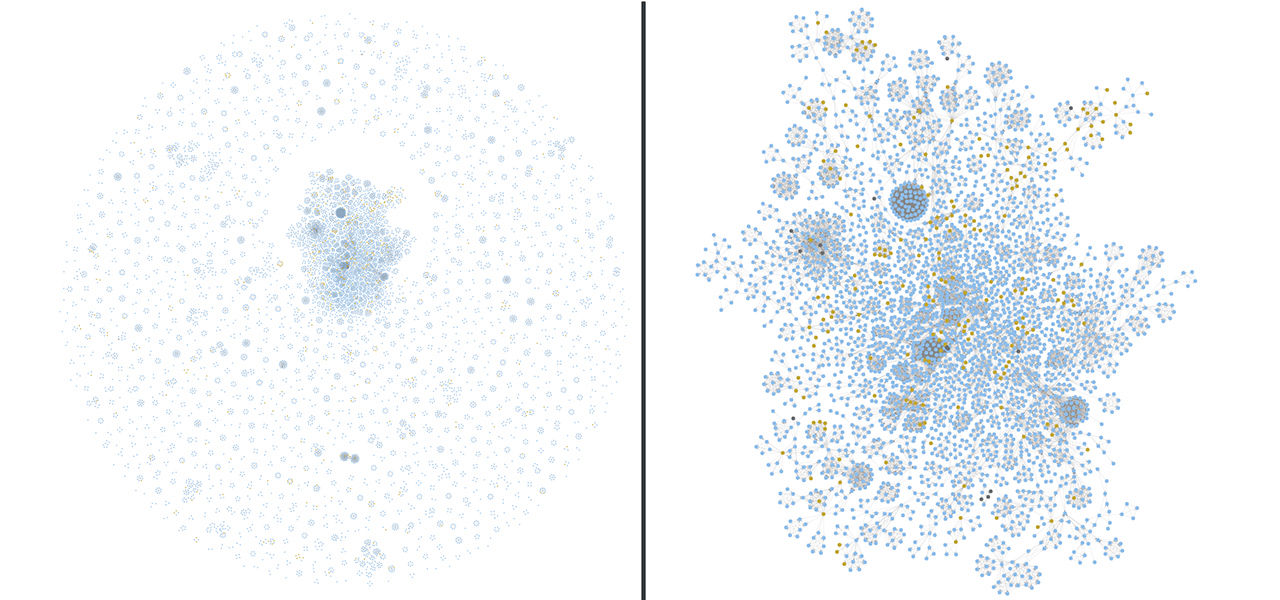
When we separate members in the commercial period (from 1988), who have either only been part of commercial or non-commercial expeditions we can see several striking differences:
Within the biggest components:
The comparison between the network and largest components seems to suggest slightly different group dynamics than the hypotheses made in (Savage & Torgler, 2013).
Commercial | Non-Commercial | |
---|---|---|
Total network size | 15733 | 10062 |
Largest component size | 10727 | 3541 |
Largest component relative size |
62.8% | 35.2% |
Ratio of triangle count | 7e-7 | 7e-7 |
Average member's node triangle count | 46.5 | 34.7 |
Average member's local clustering coefficient | 0.86 | 0.87 |
Average member's relationship strength | 1.02 | 1.1 |
Proportion of Non-Sherpa/Tibetans | 91.9% | 94.1% |
Proportion of Tibetans | 1.5% | 0.4% |
Proportion of Sherpas | 6.6% | 5.5% |
Proportion of Sherpa/Tibetan to Non-Sherpa/Tibetan relationships | 27.6% | 11.9% |
Proportion of intra Non-Sherpa/Tibetan relationships | 67.2% | 87.0% |
Conductance of the Sherpa/Tibetan community | 0.59 | 0.85 |
Conductance of the Non-Sherpa/Tibetan community | 0.17 | 0.06 |
Proportion of members who joined only 1 expedition
|
73.1% | 68.8% |
Global statistics of the largest component of the network of commercial and non-commercial expedition members (from 1988)
The network of non-commercial expedition members is much more fragmented than the network of commercial expedition members, even lacking a real giant component. In the commercial network, there is a higher proportion of Sherpas (6.6% vs 5.5%) and Tibetans (1.5% vs 0.4%), and a higher proportion of Sherpas/Tibetans to Non-Sherpa/Tibetans relationships. The conductance* of the Non-Sherpa/Tibetan community is also higher in the commercial expedition members (0.17 vs 0.06). The lower the conductance score the more well-knit the community is but the more isolated it is from the rest of the network. These data seem to show that members of commercial expeditions have more interactions with Sherpas and Tibetans, while members of non-commercial expeditions are more fragmented into small and closed communities with proportionally less interactions with Sherpas and even less with Tibetans.
We see however that the conductance of the Sherpa/Tibetan community is lower for the commercial expedition members (0.67 vs 0.87). This partly contradicts the hypothesis made above, as it would suggest that the Sherpa/Tibetan community is more well-knit and more isolated in the commercial network. We suspect that, as the proportion of Sherpas and Tibetans is higher in the commercial network, they tend to form more of a community of their own, especially if they work together repeatedly on commercial expeditions. The intuition would want that community to be thus less diffused into the community of Non-Sherpa/Tibetans.
There is also a slightly higher proportion of members of commercial expeditions who climb in only 1 expedition (73.13% vs 68.79%). This just very slightly supports the hypothesis that commercial expedition members “do not repeatedly climb and interact”. But we question the significance of this difference between the two communities.
* (the ratio of relationships pointing outside the community to the total number of relationships of the community)

Multiple statements are made in (Savage & Torgler, 2013) about the interaction between commercial and non-commercial climbers and the Sherpas or the persons they hire. The objective is to try to evaluate them by using a least squares regression to estimate the effect of commercialization on relationships between the sub communities within the commercial and non-commercial expedition members' network largest components.
(Heil, 2008, p.4)
We try to evaluate the effect of commercial expeditions on 3 aspects of the community relationships: how well-connected members are connected within their communities, the strength of those relationships, and finally how well they are connected to other communities. Based on the statements made by (Savage & Torgler, 2013), we should see that commercial expeditions have a negative effect on all of these aspects. We perform an analysis on each of these community relationship properties separately and emit the null hypothesis that commercial expeditions have no effect on each of them.
We will use 3 proxy variables to try to estimate the cohesiveness of the communities and strength of the relationships that the climbers create through the expeditions they participate in:
Note that if (Savage & Torgler, 2013) not only mention the strength of relationships but also the “emotional bond” between the members. We do not intend to evaluate that aspect of the relationships.
Many aspects of the communities can however also affect the properties of community relationships. We try to control for the following aspects as we can expect communities with different values to exhibit different cohesiveness:
Finally, there are many algorithms to detect communities in networks, which all optimize for different properties of the communities. To make sure our results are not specific to an algorithm and to improve the robustness of the results, we use 3 different algorithms offered by the Neo4j Graph Data Science library to detect communities:
We perform separately the regression analysis to evaluate the effect of commercial expeditions on the 3 network properties on each set of communities detected by each algorithm (see results below).
Modularity Optimization Algorithm | Leiden Algorithm | Label Propagation Algorithm | |
---|---|---|---|
Commercial | 1455 | 53 | 944 |
Non-commercial | 465 | 53 | 303 |
Number of communities detected by each algorithm for both commercial and non-commercial expedition member networks.
As mentioned previously there is a size imbalance between the commercial and non-commercial expedition member networks; the biggest component of the commercial network being a bit less than 3 times the size of the biggest component in the non-commercial network. This results in a huge imbalance in the number of communities detected by the algorithms on both networks with many more communities detected in the commercial expedition members network.
For the Modularity Optimization algorithm, the non-commercial communities are 24% of the samples, and 24% again for the Label Propagation algorithm. This unfortunately weakens the power of the regression analysis as we have a smaller sample size for the non-commercial communities (the control group).
The communities detected by all 3 community detection algorithms are computed communities. We plot the distribution of the number of communities detected by each algorithm on each of the independent variables we control for.
Community distribution by independent variable for the Neo4j Modularity Optimization, Leiden and Label Propagation community detection algorithms. The communities detected by the Leiden algorithm, although similar in quantity, show very different distributions on almost all independent variables.
As expected, we see a higher number of communities detected by the algorithms on the commercial expeditions’ network compared to the non-commercial expeditions' network. But despite the difference in quantities, the distributions of these communities are pretty similar in both cases across all independent variables for both the Modularity Optimization and Label Propagation algorithms. This suggests that despite these are computed communities, they are similar communities in both networks, supporting the robustness of the comparison. However, this is not the case for the Leiden algorithm where the number of communities are very similar, but their distributions are very different across the independent variables suggesting that we are comparing very different communities in both networks, weakening the robustness of the results for this algorithm.
Looking at the regression analysis for the effect of commercialization on community cohesiveness (ratio of triangle count) and relationship strength we see that commercialization does not have a significant effect for both the Modularity Optimization and Label Propagation algorithms, but has a positive effect when looking at the communities detected by the Leiden algorithm. We see however that for all 3 algorithms, commercialization has a positive effect on community conductance, meaning that the detected communities are more connected to other communities.
Dependent variable:ratioTriangleCount | |||
Communities Detected by Modularity Optimization Algorithm | Communities Detected by Leiden Algorithm | Communities Detected by Label Propagation Algorithm | |
(1) | (2) | (3) | |
commercial | -0.024 | 0.055** | 0.014 |
(0.019) | (0.022) | (0.021) | |
nbMembers | -0.005*** | 0.000 | -0.001 |
(0.001) | (0.000) | (0.000) | |
pctNonSherpaNonTibetans | 0.105** | 0.045 | 0.161** |
(0.053) | (0.132) | (0.077) | |
pctSherpas | 0.120* | 0.146 | 0.226** |
(0.067) | (0.136) | (0.089) | |
pctTibetans | 0.373*** | -0.229 | 0.435** |
(0.134) | (0.297) | (0.200) | |
pctFemaleMembers | -0.017 | -0.001 | -0.053 |
(0.037) | (0.096) | (0.047) | |
nbNationalities | -0.014*** | -0.002* | -0.015*** |
(0.005) | (0.001) | (0.004) | |
ageDifference | -0.001 | -0.002*** | -0.008*** |
(0.001) | (0.001) | (0.001) | |
avgNbLedExpeditions | -0.176*** | 0.368*** | -0.163*** |
(0.029) | (0.047) | (0.038) | |
avgNbJoinedExpeditions | -0.047** | -0.019 | -0.142*** |
(0.021) | (0.041) | (0.028) | |
avgNbWorkedforExpeditions | -0.076** | 0.115 | -0.144*** |
(0.037) | (0.091) | (0.047) | |
avgNbSuccessfulExpeditions | 0.005 | -0.055* | 0.038** |
(0.015) | (0.029) | (0.019) | |
avgAltitudeClimbed | -0.014** | 0.015 | -0.029*** |
(0.007) | (0.017) | (0.008) | |
avgAmountFixedRopes | -0.009 | -0.010 | -0.012 |
(0.011) | (0.013) | (0.015) | |
Observations | 1,920 | 111 | 1,247 |
R2 | 0.094 | 0.610 | 0.267 |
Adjusted R2 | 0.088 | 0.558 | 0.259 |
Residual Std. Error | 0.304 (df=1906) | 0.073 (df=97) | 0.277 (df=1233) |
F Statistic | 15.225*** (df=13; 1906) | 11.665*** (df=13; 97) | 34.462*** (df=13; 1233) |
Note: | *p<0.1; **p<0.05; ***p<0.01 |
Dependent variable:avgRelationshipStrength | |||
Communities Detected by Modularity Optimization Algorithm | Communities Detected by Leiden Algorithm | Communities Detected by Label Propagation Algorithm | |
(1) | (2) | (3) | |
commercial | -0.010 | 0.050** | 0.006 |
(0.007) | (0.024) | (0.008) | |
nbMembers | 0.000 | -0.000 | 0.001*** |
(0.000) | (0.000) | (0.000) | |
pctNonSherpaNonTibetans | 0.139*** | 0.161 | 0.116*** |
(0.020) | (0.142) | (0.028) | |
pctSherpas | 0.316*** | 0.231 | 0.284*** |
(0.026) | (0.146) | (0.033) | |
pctTibetans | 0.266*** | 0.086 | 0.294*** |
(0.051) | (0.319) | (0.073) | |
pctFemaleMembers | -0.019 | 0.162 | 0.017 |
(0.014) | (0.103) | (0.017) | |
nbNationalities | -0.010*** | -0.002 | -0.009*** |
(0.002) | (0.001) | (0.001) | |
ageDifference | -0.001*** | -0.001 | -0.001*** |
(0.000) | (0.001) | (0.000) | |
avgNbLedExpeditions | 0.173*** | 0.246*** | 0.172*** |
(0.011) | (0.051) | (0.014) | |
avgNbJoinedExpeditions | 0.257*** | 0.406*** | 0.269*** |
(0.008) | (0.044) | (0.010) | |
avgNbWorkedforExpeditions | 0.069*** | 0.399*** | 0.093*** |
(0.014) | (0.097) | (0.017) | |
avgNbSuccessfulExpeditions | 0.030*** | -0.004 | 0.022*** |
(0.006) | (0.031) | (0.007) | |
avgAltitudeClimbed | -0.015*** | -0.016 | -0.012*** |
(0.003) | (0.018) | (0.003) | |
avgAmountFixedRopes | 0.002 | 0.001 | -0.004 |
(0.004) | (0.013) | (0.005) | |
Observations | 1,920 | 111 | 1,247 |
R2 | 0.538 | 0.743 | 0.534 |
Adjusted R2 | 0.535 | 0.709 | 0.529 |
Residual Std. Error | 0.116 (df=1906) | 0.079 (df=97) | 0.102 (df=1233) |
F Statistic | 170.729*** (df=13; 1906) | 21.586*** (df=13; 97) | 108.722*** (df=13; 1233) |
Note: | *p<0.1; **p<0.05; ***p<0.01 |
Dependent variable:conductance | |||
Communities Detected by Modularity Optimization Algorithm | Communities Detected by Leiden Algorithm | Communities Detected by Label Propagation Algorithm | |
(1) | (2) | (3) | |
commercial | 0.091*** | 0.065*** | 0.078*** |
(0.010) | (0.009) | (0.010) | |
nbMembers | -0.005*** | -0.000 | -0.001*** |
(0.000) | (0.000) | (0.000) | |
pctNonSherpaNonTibetans | 0.045 | -0.026 | 0.089** |
(0.029) | (0.056) | (0.037) | |
pctSherpas | -0.037 | 0.033 | -0.042 |
(0.037) | (0.058) | (0.043) | |
pctTibetans | 0.241*** | -0.080 | 0.110 |
(0.073) | (0.126) | (0.096) | |
pctFemaleMembers | 0.031 | 0.025 | 0.053** |
(0.020) | (0.041) | (0.023) | |
nbNationalities | 0.002 | 0.001** | 0.005** |
(0.002) | (0.001) | (0.002) | |
ageDifference | -0.004*** | 0.000 | -0.004*** |
(0.000) | (0.000) | (0.000) | |
avgNbLedExpeditions | -0.024 | -0.004 | -0.014 |
(0.016) | (0.020) | (0.018) | |
avgNbJoinedExpeditions | 0.008 | 0.064*** | -0.001 |
(0.012) | (0.018) | (0.013) | |
avgNbWorkedforExpeditions | 0.108*** | 0.042 | 0.106*** |
(0.020) | (0.039) | (0.023) | |
avgNbSuccessfulExpeditions | 0.012 | -0.028** | 0.012 |
(0.008) | (0.012) | (0.009) | |
avgAltitudeClimbed | 0.009** | 0.005 | 0.003 |
(0.004) | (0.007) | (0.004) | |
avgAmountFixedRopes | -0.001 | 0.001 | -0.008 |
(0.006) | (0.005) | (0.007) | |
Observations | 1,920 | 111 | 1,247 |
R2 | 0.216 | 0.574 | 0.192 |
Adjusted R2 | 0.210 | 0.517 | 0.184 |
Residual Std. Error | 0.166 (df=1906) | 0.031 (df=97) | 0.133 (df=1233) |
F Statistic | 40.326*** (df=13; 1906) | 10.069*** (df=13; 97) | 22.603*** (df=13; 1233) |
Note: | *p<0.1; **p<0.05; ***p<0.01 |
However, as we use the same community samples to repeatedly perform three different regression analyses, we use a Bonferroni correction to compensate for the multiple hypothesis testing. After correcting the p-values, the effect of commercialization on average relationship strength goes above 0.05 for the Leiden Algorithm and we also fail to reject the null hypothesis in that case too.
Modularity Optimization Algorithm | Leiden Algorithm | Label Propagation | |
---|---|---|---|
Ration of triangle count | False | True | False |
Average relationship strength | False | False | False |
Conductance | True | True | True |
Summary, after Bonferroni correction, of the rejection of the null hypothesis that commercialization has no effect on the network metrics of the communities detected by Neo4j's Modularity Optimization, Leiden and Label Propagation community detection algorithms.
But since, the distribution of the communities detected by the Leiden algorithm are very different for commercial and non-commercial expedition networks, weakening the robustness of this result, and we fail to reject the null hypothesis for communities detected by the other 2 algorithms, we conclude that:
The results of the analysis are quite unexpected and do not align with many of the statements made by (Savage & Torgler, 2013). The results suggest that the non-commercial expedition members' network is a community oriented toward itself with a fewer proportion of Sherpas and Tibetans and fewer interactions with these communities. We also fail to reject the null hypothesis that commercialization has no effect on community cohesion and relationship strength and even detect a positive effect of commercialization on the relationships between communities which are more connected to each other than for non-commercial expeditions.
We acknowledge however that these results are highly dependent on the assumptions made and techniques used in the analysis:
Despite all these shortcomings, to the best of our knowledge, this network analysis of the Himalayan Database is the first of its kind and by providing a tool to the community to convert the Himalayan Database into a Neo4j graph database, we hope it will encourage new further research approaches on the Himalayan Database.